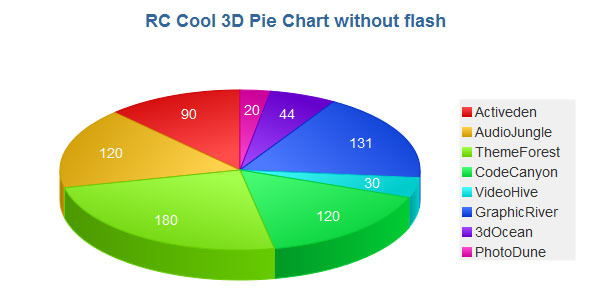
3D Pie Chart with JavaScript
✅ Include Licence Certificate
✅ Future Lifetime Official updates
✅ 100% Original Lisence Key
✅ Great Savings Money.
✅ Latest Version Guarantee
✅ 1 domain will be activated.
✅No Crack, No GPL, No Null, 100 % Original Product
615৳
-
৳ BDT
-
$ USD
In stock
Payment Methods:

Description
Introducing the 3D Pie Chart with JavaScript, the ultimate tool for data visualization that brings your data to life. Designed for developers and businesses alike, this dynamic charting solution allows you to present your data in an engaging and visually appealing manner. Whether you are creating reports, dashboards, or presentations, this 3D Pie Chart is an essential component to convey information clearly and effectively.
Key Features
- Stunning 3D Visualization: Captivate your audience with a visually rich 3D pie chart that stands out from traditional 2D graphics.
- Interactive Elements: Users can hover and click on sections to view detailed data, making the experience more engaging and informative.
- Customizable Design: Easily modify colors, labels, and sizes to match your branding and presentation style.
- Lightweight and Efficient: The chart is optimized for performance, ensuring quick load times without compromising quality.
- Responsive Layout: Seamlessly adapt to various screen sizes and devices, making it perfect for web applications and mobile sites.
Benefits & Usage:
The 3D Pie Chart with JavaScript empowers you to transform complex datasets into easily digestible visual formats. By utilizing this tool, you can enhance your presentations, making them more impactful and memorable. Whether you're a data analyst presenting findings, a marketer showcasing campaign results, or an educator conveying statistical information, this chart will facilitate better understanding and retention. With its interactive features, users can explore data in depth, allowing for a more personalized experience.
Moreover, integrating this chart into your project is simple, even for those with limited coding experience. The straightforward documentation provides step-by-step instructions, ensuring you can get started quickly and efficiently.
Additional Info
The 3D Pie Chart is developed using high-quality JavaScript, ensuring compatibility across various platforms and browsers. It requires minimal resources to run, making it suitable for both small and large-scale applications. There are no specific care instructions, as this is a software product; however, regular updates and support are provided to enhance functionality and user experience.
Invest in the 3D Pie Chart with JavaScript today for just 615 BDT and elevate your data visualization game to new heights. Make your data shine and tell a compelling story that resonates with your audience.
Customer Reviews
Only logged in customers who have purchased this product may leave a review.


Reviews
There are no reviews yet.